Rules for import and export to Crimea. Duty-free import and export. Alcohol and tobacco products
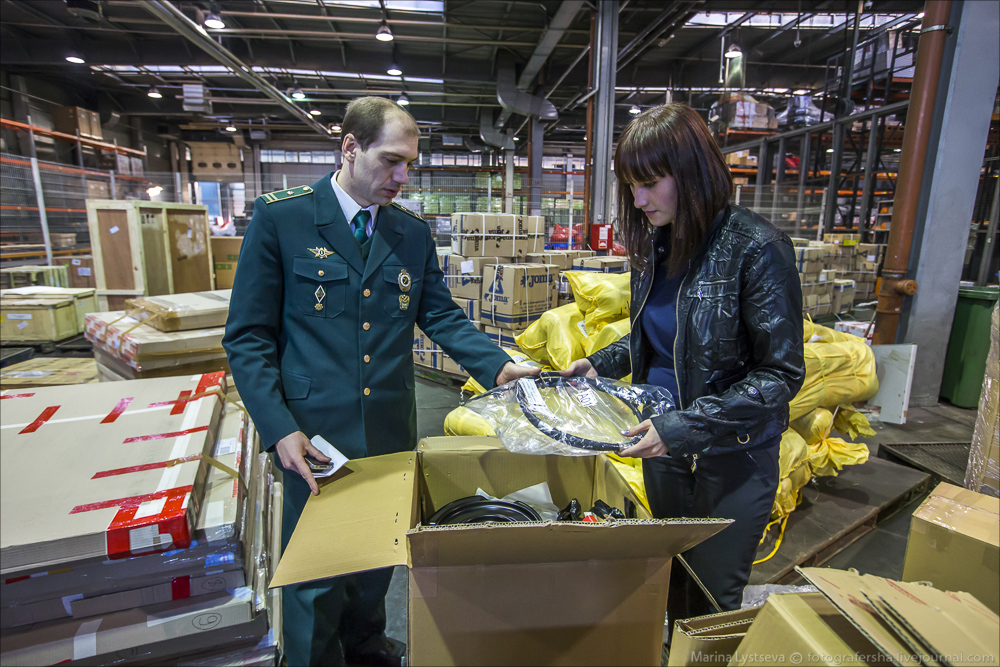
Tourists often travel abroad for shopping or return with souvenirs after a vacation. But not everyone pre-reads Russian customs rules in 2017. The document contains items (their quantity) that are allowed to be transported across the border without any problems, as well as those that are declared and subject to payment of a fee.
Before going on a tour and making a list of hotels, souvenirs and purchases, you need to know that you will have to cross them off the list.
Money
The allowed amount of money varies for everyone. However, you can notify at the border about your monetary potential and not have problems if the import of currency does not exceed $10,000 (the sum of traveler's checks and cash).
The import and export of currency across the Russian border is allowed without additional paperwork, if it is no more than $1 thousand - a customs declaration is not required.
A large amount requires permission from the Central Bank of the Russian Federation.
Alcohol and tobacco products
According to the import rules, these goods are allowed to be transported only by persons over 18 years of age. Restrictions in force in 2016:
How many liters of alcohol can be imported into Russia without a declaration - three liters, and you will not have to pay duty. Alcohol can be anything.
In excess of the established duty-free limits, you can carry 2 liters of alcohol, but it fits into the declaration. The customs fee for each liter is 10 euros, for two in excess you will have to pay 20 euros.
tobacco – 250 g;
cigarettes in quantity 200 pieces;
cigarillos in quantity 100 pcs.;
50 cigars.
Among tobacco products you are allowed to choose only one thing.
For violation customs rules Administrative charges will arise regarding the import of alcohol. cases, fines, seizure of goods. 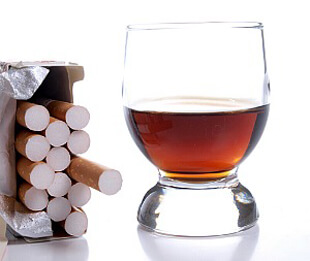
There are no restrictions on the rules for exporting alcoholic beverages from Russia. However, they are present in customs regulations other powers. That is, you are allowed to export as much as you like, but you cannot import it into another power. But always proceed from the rule that you can export goods from a country in the quantity needed for logical use.
Duty-free import and export
In order to transport things across the Russian border and not fill out a declaration and, accordingly, not pay a fee, the following requirements are put forward for luggage:
1. Luggage weighs no more than kg.
2. Everything that you plan to transport across the border must be intended for personal use.
3. The cost of luggage is no more than 1,500 euros if you enter the Russian Federation by land transport, by air - 10 thousand euros.
The exception is things imported by migrants and refugees. But they will have to document their status. There is also a special attitude towards things that you inherited. But in order to transport them, you will need to show documents about their ownership at the border.
The rules for duty-free import of goods into Russia apply to works of art, but they must be declared, and after crossing the border, apply to the Ministry of Culture for registration.
If you violate customs rules, you will have to pay a fine and incur administrative fees. responsibility. Sometimes things prohibited for import into the country may be confiscated.
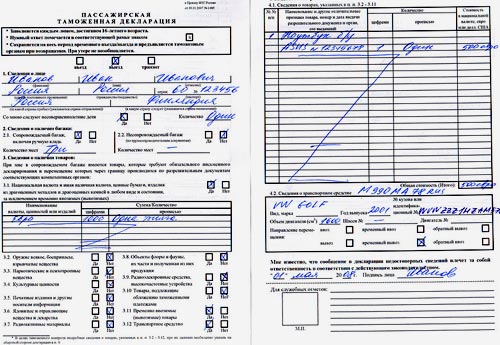
Mandatory declaration
The declaration indicates any currency of cash if the amount is more than $10,000. If your intention is to cross the border with large sums in your pocket - 20,000-30,000, then you will have to have additional permit papers.
The document also indicates 2 liters of alcohol if you have exhausted the duty-free limit.
Imported personal items are also included if their total value is greater:
for air travel – 10 thousand euros;
train trip – 1500 euros.
Customs clearance rules Russian Federation provide for entering a declaration when traveling home the following things:
Precious metals and stones;
Encryption devices operating at frequencies above 9 kHz; signal reception and transmission devices;
Cultural values, works of art;
Potent medications;
Explosives, weapons.
For some of the items listed, you will need an export permit, for example, a doctor's prescription for the export of certain medications.
It is prohibited to export
It is prohibited to export from Russia:
1. More than 5 kg of seafood and fish;
2. Precious metals and any metal worth over 25 thousand dollars;
3. Black caviar. It is allowed to transport it only if you have store receipts and if it is in the original packaging. You are allowed to bring 250 g of sturgeon caviar per person.

Export rules do not allow ammunition, cultural property, rare plants and animals, or hazardous substances to be sent across the border without departmental permits.
Propaganda literature and pornographic goods are also prohibited. If these requirements are deliberately violated, then liability for violation of customs rules will be more stringent.
Video:
ZAYN - Dusk Till Dawn ft. Sia
The new Customs Code of the Eurasian Economic Union (EAEU) will come into force no earlier than January 1, 2017. The process is being delayed by fundamental differences between the member states of the union in their approaches to the principles of customs regulation.
According to Sergei Sokolov, Advisor to the Department of Customs Legislation and Law Enforcement Practice of the Eurasian Economic Commission (EEC), the results of internal approvals of the draft Customs Code are now being summed up. The commission received about one and a half thousand comments from Belarus, Kazakhstan and the Russian Federation. Armenia and Kyrgyzstan, which joined the work later than the other EAEU members, actively participated in the discussion of the amendments.
Both Belarus and Russia, for the most part, sent comments of a technical nature, which we are discussing on a routine basis, says Sergei Sokolov. - Kazakhstan has approached the issue radically and insists on significantly increasing the role of the national segment in customs regulation. According to Kazakhstan’s proposals, the code should be a framework document, and it is proposed to preserve only the customs transit system as a unified one within the EAEU.
The position of the EEC on this issue is as follows: customs regulation at the national level within a single customs territory will lead to the destruction of trust between members of the union and will interfere with the achievement of the common goals of the EAEU. The participants of the EAEU summit, which was held at the level of deputy prime ministers of states, also agreed not to reduce the current level of integration.
Another controversial issue concerns special economic zones (SEZ) in the Kaliningrad and Magadan regions. The current TC project has two applications. One sets out the specifics of transportation and transactions in relation to goods moved between the territory of the westernmost Russian region and the main part of the EAEU. In the other, there are rules on goods that are located and used in the territory of free customs zones created on a territorial basis.
This year, Kazakhstan and Belarus proposed to exclude from the draft code all features of the functioning of the Kaliningrad and Magadan SEZs, spelling out the rules in separate agreements. This position was supported by Armenia and Kyrgyzstan. However, Russia insists on maintaining the annexes that relate to the SEZ.
The Ministry of Economic Development and the Federal Customs Service assume that the effectiveness of the operators of free economic zones depends on the stability and immutability of previously reached agreements between the member states of the EAEU, emphasizes Dmitry Kozlov, adviser to the department of coordination, development and regulation of foreign trade activities of the Ministry of Economic Development.
As a result, the entry into force of the EAEU Customs Code, which was supposed to take place on January 1, 2016, is postponed.
If a favorable forecast comes true, the document will go into effect on January 1, 2017, shares Sergei Sokolov. - I would prefer not to count on an unfavorable prognosis. Everything will depend on how quickly and effectively the negotiators find compromise solutions on controversial issues.
The increase in orders from foreign online stores is very worrying for many. Foreign online stores have a huge advantage over Russian sellers when carrying out duty-free trading. As a result, domestic stores are going under, and the treasury is missing out on a significant portion of the fees. In order to solve this problem, the Eurasian Economic Commission (EEC) proposes to reduce the duty-free import threshold.
Two stages of changing the threshold for duty-free import of goods.
- From January 1, 2019, it will be possible to purchase goods worth up to 500 euros without paying additional duty. If this limit is exceeded, you will have to pay a duty of 30%, but not less than 4 euros per 1 kg.
- The second stage is planned for January 1, 2020, when the rate of duty-free import of goods will be reduced to 200 euros. But at the same time, the duty rate will also decrease to 15%, but not less than 2 euros per 1 kg.
It is believed that these changes in the rules of duty-free import will not greatly affect Russians who make purchases on Aliexpress and other foreign online stores, since for most buyers the average cost of goods is no more than $100.
But this bill will reduce the number of small commercial lots that our compatriots order under the guise of goods for personal use. Which will lead to improved economic conditions and a leveling of the competitive landscape. Of course, ordinary buyers are not happy about the upcoming changes. Since, due to the current economic conditions, purchasing goods on the same Aliexpress platform is in a good way savings.
Size customs duty in 2017.
On this moment, in 2017, customers can order monthly products whose total cost is less than 1,000 euros and whose weight does not exceed 31 kg. If the buyer does not meet this standard, he will have to pay a duty of 30% of the cost of the goods, but not less than 4 euros per 1 kg. We can only be glad that at the moment the standards for Russia and Kazakhstan are among the highest in the world. For example, in the Republic of Belarus and the European Union, the norm is only 22 euros.
According to customs statistics, in the first half of 2017, Russia’s foreign trade turnover amounted to 270.4 billion US dollars and increased by 28.1% compared to the first half of 2016.
Trade balance there was a positive amount of 66.8 billion US dollars, which is 15.9 billion US dollars more than in January-June 2016.
Export to Russia in the first half of 2017 amounted to 168.6 billion US dollars and increased by 28.7% compared to the first half of 2016.
The basis of Russian exports toIhalf of 2017 to distant countries abroad traditionally fuel and energy products, the share of which in the commodity structure of exports to these countries amounted to 66.6% (in the first half of 2016 - 62.3%). Compared to January-June 2016, the value volume of fuel and energy goods increased by 38.3%, and the physical volume - by 3.6%. Among the goods of the fuel and energy complex, the physical volumes of exports of coal increased by 10.5%, natural gas - by 9.7%, diesel fuel - by 4.0%, and crude oil - by 1.5%. At the same time, the physical volumes of exports of motor gasoline decreased by 25.5%, kerosene - by 15.5%.
In the total value of exports to non-CIS countries, the share of metals and metal products in the first half of 2017 amounted to 9.9% (in the first half of 2016 - 9.8%). The value volume of exports of these goods increased by 30.8% compared to January-June 2016, while the physical volume decreased by 3.9%. The physical volumes of exports of cast iron decreased by 15.5%, aluminum - by 7.4%, semi-finished iron and non-alloy steel - by 3.6%. At the same time, the physical volumes of exports of copper and copper alloys increased by 13.7%, ferroalloys - by 11.3%, flat rolled iron and non-alloy steel - by 6.6%.
The share of exports of chemical industry products in the first half of 2017 was 5.7% (in the first half of 2016 - 6.7%). Compared to January-June last year, the value of exports of these products increased by 10.3%, and the physical volume - by 1.1%. The physical volumes of supplies of inorganic chemical products increased by 28.8%, plastics and products made from them - by 26.6%, fertilizers - by 1.4%.
The share of exports of machinery and equipment in the first half of 2017 was 4.9% (in the first half of 2016 - 6.1%). The value of exports of this product group increased by 4.2%, including mechanical equipment - by 24.6%, optical and medical instruments and apparatus - by 30.1%, and electrical equipment - decreased by 21.6%. The physical volumes of supplies of passenger cars increased by 2.0 times, and trucks decreased by 31.3%.
The share of exports of food products and raw materials for their production in the commodity structure of exports in the first half of 2017 amounted to 4.4% (in the first half of 2016 - 4.9%). Compared to January-June 2016, the value and physical volumes of supplies of these goods increased by 17.6% and 12.7%, respectively.
The share of exports of timber and pulp and paper products in the first half of 2017 was 3.2% (in the first half of 2016 - 3.5%). The physical volume of exports of this product group increased by 6.2%. The volume of supplies of lumber increased by 13.1%, while the volume of exports of unprocessed timber decreased by 5.2%, cellulose - by 2.6%, and plywood - by 2.0%.
In the commodity structure of exports to CIS countries in the first half of 2017, the share of fuel and energy products amounted to 34.4% (in the first half of 2016 - 36.2%). The value of exports of these goods increased by 20.3%, while physical volumes decreased by 5.1%. Physical volumes of crude oil exports decreased by 23.7%, electricity - by 12.5%. At the same time, physical volumes of supplies of coke increased by 78.3%, petroleum products - by 37.8%, natural gas - by 3.8%.
The share of machinery and equipment in the first half of 2017 was 15.8% (in the first half of 2016 - 13.8%). The value of exports of these goods increased by 45.5%. Including an increase in the value of supplies of funds ground transport, except for railway by 80.5%, mechanical equipment - by 27.8%. The physical volume of exports of passenger cars decreased by 4.6%, and trucks increased by 28.8%.
The share of chemical industry products in the commodity structure of exports to the CIS countries in the first half of 2017 was 15.3% (in the first half of 2016 - 15.9%). Compared to January-June 2016, the value and physical volumes of supplies of these goods increased by 21.2% and 11.8%, respectively. Export volumes of fertilizers increased by 57.5%, plastics and products made from them - by 7.4%, organic chemical products - by 4.6%, rubber - by 3.6%. At the same time, the physical volumes of exports of inorganic chemical products decreased by 16.1%, pharmaceutical products - by 7.6%.
The share of metals and metal products in exports to the CIS countries in the first half of 2017 amounted to 12.0% (in the first half of 2016 - 11.6%). The value of exports of this product group increased by 31.2% compared to January-June 2016, and the physical volume - by 9.1%. The physical volumes of exports of ferrous metals and products made from them increased by 9.1%, including ferroalloys - by 2.0 times, semi-finished products from iron or unalloyed steel - by 48.1%, flat rolled products from iron and unalloyed steel - by 18 .6%.
The share of food products and raw materials for their production in the commodity structure of exports in the first half of 2017 was 10.3% (in the first half of 2016 - 10.6%). Compared to January-June 2016, the value of supplies of these goods increased by 22.1%, and physical volumes - by 10.1%. The physical volumes of exports of wheat increased by 53.0%, vegetable oil - by 19.0%, fresh and frozen fish - by 16.4%. At the same time, supplies of milk and cream decreased by 22.8%, cheeses and cottage cheese - by 8.5%.
Export share timber and pulp and paper products in the first half of 2017 amounted to 4.3% (in the first half of 2016 - 4.4%). The value and physical volumes of exports of this product group increased compared to January-June 2016 by 24.1% and 10.3%, respectively. The physical volumes of exports of lumber increased by 8.1%, plywood - by 6.9%, cellulose - by 3.5%.
Import from Russia in the first half of 2017 amounted to 101.8 billion US dollars and increased by 27.2% compared to the first half of 2016.
In the commodity structure of imports from foreign countries the share of machinery and equipment in the first half of 2017 accounted for 50.1% (in the first half of 2016 - 47.2%). The value of imports of these products increased by 34.6% compared to January-June 2016. The value of supplies of land transport means, except railway, increased by 42.4%, mechanical equipment - by 34.8%, electrical equipment - by 24.6%, instruments and optical apparatus - by 21.3%. The physical volume of imports of passenger cars decreased by 9.8%, and imports of trucks increased by 39.1%.
The share of chemical industry products in the commodity structure of imports in the first half of 2017 was 19.0% (in the first half of 2016 - 20.2%). The value volume of imports of chemical industry products increased by 19.0% compared to January-June 2016, and the physical volume - by 3.6%. The volumes of physical supplies of rubber, rubber and products made from them increased by 20.7%, organic compounds - by 13.6%, plastics and products made from them - by 9.8%, paints and varnishes - by 6.6%, perfumes - by 4.6%, pharmaceutical products - by 4.2%.
The share of imports of food products and raw materials for their production in the first half of 2017 amounted to 12.3% (in the first half of 2016 - 13.8%). The value and physical volumes of imports increased by 13.5% and 6.5%, respectively. Physical volumes of supplies of milk and condensed cream increased by 2.8 times, fresh and frozen fish - by 14.3%, citrus fruits - by 6.4%.
The share of metals and products made from them in the commodity structure of imports in the first half of 2017 was 5.9% (in the first half of 2016 - 5.5%). The value volume of this product group increased by 36.1% compared to January-June 2016, and the physical volume - by 62.3%. The physical volumes of imports of pipes increased by 1.9 times, ferrous metals and products made from them - by 68.2%, flat rolled iron and non-alloy steel - by 48.3%.
The share of textiles and footwear in the first half of 2017 was 5.8% (in the first half of 2016 - 5.9%). The value and physical volumes of imports of these goods increased compared to the same period last year by 24.6% and 18.3%, respectively.
In the commodity structure of imports from CIS countries in the first half of 2017, the share of food products and raw materials for their production amounted to 23.0% (in the first half of 2016 - 23.7%). The physical volumes of food supplies decreased by 2.6% compared to January-June 2016, including white sugar - by 8.6%, cheeses and cottage cheese - by 4.5%, milk and condensed cream - by 4. 3%. At the same time, the physical volumes of supplies of poultry meat increased by 19.0%, butter - by 6.2%.
The share of machinery and equipment in the first half of 2017 was 22.0% (in the first half of 2016 - 23.4%). The value of imports of this product group increased by 20.7% compared to January-June 2016. The value of supplies of railway equipment and their parts increased by 1.9 times, land transport means, except railway - by 56.7%, mechanical equipment - by 19.8%, at the same time, the volume of supplies of instruments and optical apparatus decreased by 23. 7%. The physical volumes of imports of passenger cars increased by 42.9%, trucks - by 34.4%.
The share of metals and products made from them in the commodity structure of imports from the CIS countries in the first half of 2017 was 16.0% (in the first half of 2016 - 12.3%). The value volume of this product group increased by 66.5% compared to January-June 2016, and the physical volume - by 43.6%. The physical volumes of imports of flat rolled iron and non-alloy steel increased by 50.4%, pipes - by 41.4%.
The share of chemical industry products in the commodity structure of imports in the first half of 2017 was 13.5% (in the first half of 2016 - 14.7%). The value volume of imports of chemical industry products increased by 18.2% compared to January-June 2016, and the physical volume - by 11.3%. The physical volumes of supplies of plastics and products made from them increased by 9.0%, of inorganic chemical products - by 8.1%, and the physical volumes of supplies of organic chemistry decreased by 11.9%.
The share of textiles and footwear in the commodity structure of imports in the first half of 2017 was 7.0% (in the first half of 2016 - 7.7%). The value and physical volumes of imports of these goods increased compared to the same period last year by 17.3% and 28.6%, respectively.
The share of imports of fuel and energy goods in the first half of 2017 amounted to 4.7% (in the first half of 2016 - 4.3%). The value volume of this product group increased by 42.5% compared to January-June 2016, and the physical volume - by 8.0%.
In the country structure of Russian foreign trade The leading place is occupied by the European Union as the country's largest economic partner. The share of the European Union in January-June 2017 accounted for 43.9% of Russian trade turnover (in January-June 2016 - 43.7%), the CIS countries - 12.3% (12.4%), the EAEU countries - 8.7% (8.7%), for APEC countries - 30.1% (29.0%).
The main trading partners of Russia in January-June 2017 among non-CIS countries were: China, trade turnover with which amounted to 38.4 billion US dollars (135.4% compared to January-June 2016), Germany - 22.9 billion dollars USA (124.2%), Netherlands - 20.6 billion US dollars (133.2%), Italy - 11.2 billion US dollars (122.2%), USA - 10.7 billion. US dollars (122.1%), Republic of Korea - 9.8 billion US dollars (149.6%), Turkey - 9.3 billion US dollars (127.5%), Japan - 8.4 billion US dollars (114.9%), Poland - 7.6 billion US dollars (137.4%), France - 7.1 billion US dollars (124.1%).
Trade volumes with CIS countries in January-June 2016-2017 are given below:
million US dollars
|
A COUNTRY |
EXPORT |
IMPORT |
||
|
January-June 2016 |
January-June 2017 |
January-June 2016 |
January-June 2017 |
|
|
AZERBAIJAN |
||||
|
BELARUS* |
||||
|
KAZAKHSTAN |
||||
|
KYRGYZSTAN |
||||
|
TAJIKISTAN |
||||
|
TURKMENIA | ||||